
Business Analytics Software for SMBs: From Spreadsheets to AI Answers

Most small businesses already own business analytics software of some kind, even if it is only a spreadsheet, a free web analytics account and the reporting screens inside their ad platforms. The real problem is that none of these tools talk to each other: the Salesforce Small & Medium Business Trends report (6th edition) found that the average SMB uses seven different business applications, and over half of SMB leaders report frequent data inconsistencies across them. This guide is written for owners and marketers in India and the UAE who do not have a data analyst, and it walks through the move from spreadsheets to dashboards, then to connected data, and finally to asking questions in plain language. If you would rather map your own data gaps with someone first, speak with the Leadmetrics team.
Key Takeaways
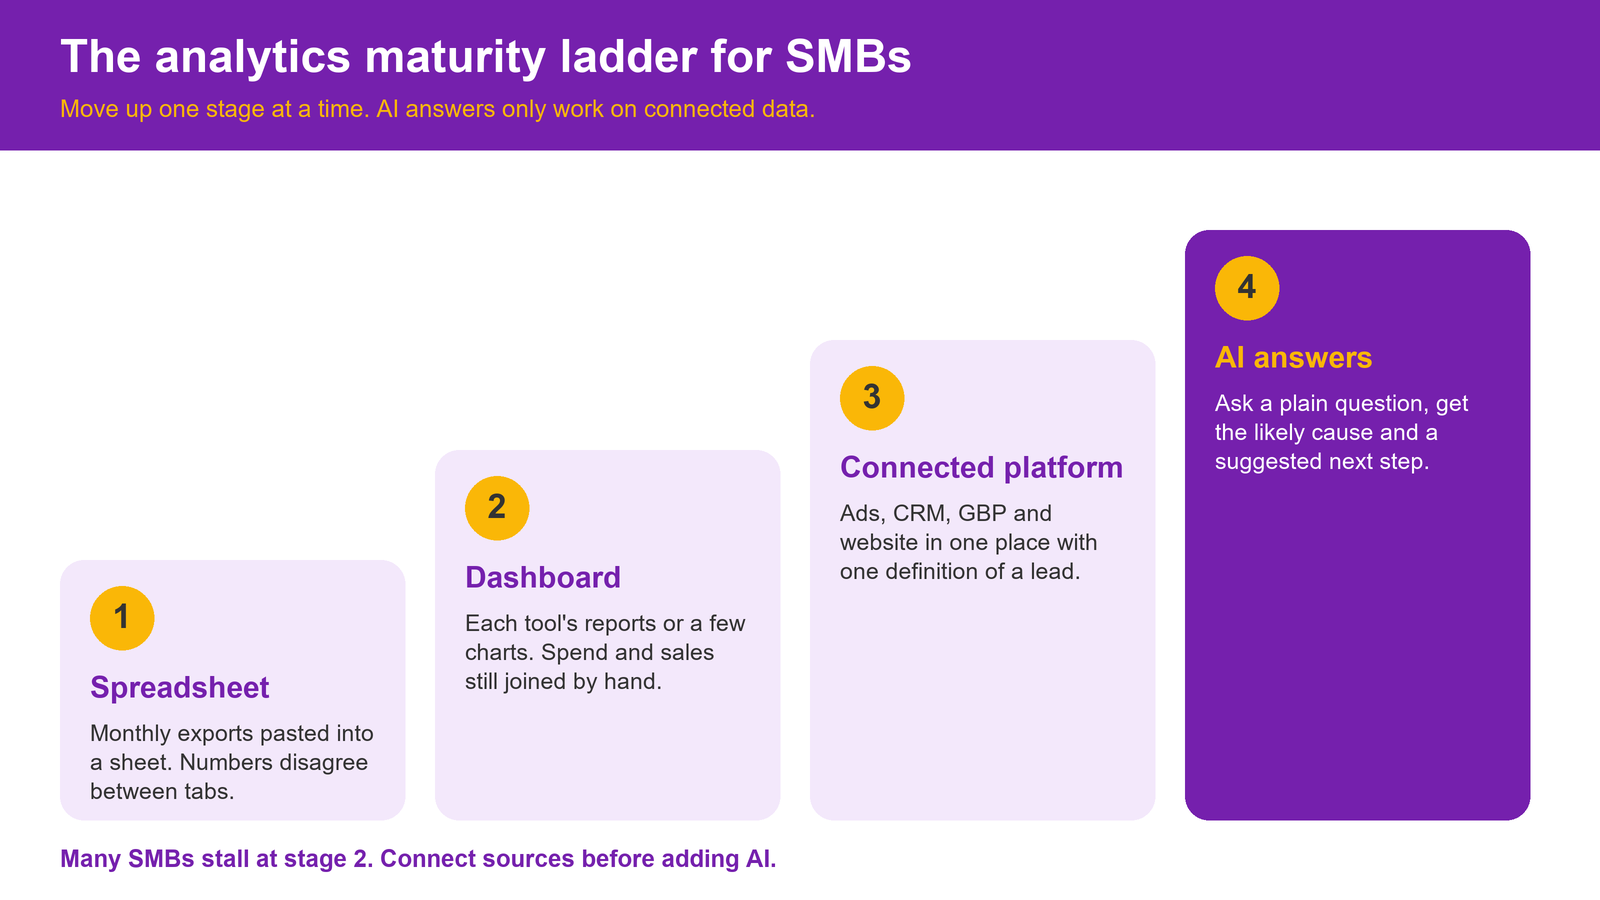
- Analytics maturity in a small business moves through four stages: spreadsheet, dashboard, connected platform and AI answers. Many SMBs stall at stage two.
- Connect marketing and sales data first (ad accounts, CRM, Google Business Profile and website), because that is where spend and leads meet.
- Judge any tool by the questions it can answer every Monday, not by the number of charts it can draw.
What are the 4 stages of analytics maturity in a small business?
Analytics maturity is not about company size. A ten-person clinic can be further along than a 200-person distributor if its numbers are connected and someone acts on them. The four stages below describe how most SMBs actually progress.
Stage 1: Spreadsheet. Someone exports numbers from the ad account, the website tool and the billing system once a month and pastes them into a sheet. It works until the person who built the sheet goes on leave, or until two tabs show different lead counts for the same week.
Stage 2: Dashboard. Each tool's built-in reports are used, or a free dashboard tool pulls a few sources into charts. This is faster, but each chart still answers one narrow question, and joining "what we spent" with "what we closed" usually still happens by hand.
Stage 3: Connected platform. Ads, CRM, website, local listings and revenue sit in one place with consistent definitions of a lead, a sale and a source. This is the point where AI business analytics becomes useful, because the system can compare channels instead of reporting them one by one.
Stage 4: AI answers. You ask "why did enquiries from Dubai drop last week?" and get an explanation with the likely drivers, not a chart to interpret. Stage 4 only works if stage 3 is done properly. AI on top of disconnected, inconsistent data simply produces confident answers to the wrong question.
Which data should you connect first: ads, CRM, GBP or website?
Start where money and leads meet. For most service businesses and B2B firms in India and the UAE, that means four sources, connected in this order:
| Order | Source | Why it comes first | Question it answers |
|---|---|---|---|
| 1 | Ad accounts (Google, Meta, LinkedIn) | Largest controllable cost | What did each lead cost by channel? |
| 2 | CRM or lead sheet | Shows which leads became customers | Which source brings paying customers, not just form fills? |
| 3 | Google Business Profile | Calls, direction requests and website clicks from Maps | How much demand comes from local search? |
| 4 | Website analytics | Conversion paths and landing page behaviour | Which pages turn visitors into enquiries? |
Ad data alone tells you about clicks. Pair it with a view of ad spend and return in one view and the CRM, and you can see cost per qualified lead instead of cost per click. The CRM side matters just as much: pipeline and lead source data is what turns "Meta brought the most leads" into "Meta brought leads that rarely close". If you are rethinking how leads are scored as part of this, our piece on AI-native CRM changes in 2027 covers that shift in detail.
On the website side, define what counts as a conversion before you connect anything. Google's own documentation on key events in Google Analytics describes a key event as "an event that measures an action that's particularly important to the success of your business." Pick three to five of these (form submit, WhatsApp click, call click, booking) and use the same names everywhere.
Search data is the fifth source once the first four are stable. Add search visibility trends so you can see whether a drop in enquiries started with a drop in rankings. Our comparison of rank checkers and AI visibility trackers explains which search metrics are worth adding to the same report.
Dashboards vs AI data analytics: what does each actually answer?
A dashboard is good at "what". It shows that leads fell this week, that cost per click rose, or that one campaign spent more than planned. It is fast to scan and easy to share with a partner or accountant.
AI data analytics is aimed at "why" and "what next". Instead of you scanning six charts to work out that the lead drop came from one paused campaign plus a slower month on Google Maps, the system looks across sources, finds the change and explains it. The Leadmetrics analytics page describes this as a five-step flow: connect, track, analyse, explain and recommend, with the stated aim of identifying what changed, why it matters and what to do next.
| Question type | Dashboard | AI data analytics |
|---|---|---|
| "How many leads did we get last week?" | Strong | Strong |
| "Which channel's cost per lead rose?" | Possible with filters | Strong |
| "Why did leads fall?" | You interpret | Explains likely drivers |
| "What should we change first?" | Not designed for it | Suggests prioritised actions |
Adoption is no longer the barrier. The Stanford HAI AI Index Report 2025 notes that 78% of organisations reported using AI in 2024, up from 55% the year before. The barrier for SMBs is data quality and time. The same Salesforce report ranks "lack of resources or expertise to extract data for analysis" as the top obstacle to acting on data, and says that less than half of SMB leaders consider their companies very data-driven.
What questions should an owner be able to answer every Monday?
A useful test for any setup: can you answer these in under ten minutes without asking anyone to build a report?
- How many qualified leads did we get last week, and from which channels?
- What did each qualified lead cost, by channel?
- How many leads were contacted within the same working day?
- Which campaign, keyword or post produced the most enquiries that turned into meetings?
- Did calls and direction requests from our Google Business Profile go up or down?
- Are we ranking for the five search terms that bring the most enquiries?
- What is the one thing we should change this week?
If questions one to six take more than an hour, you are at stage one or two. Question seven is the one most tools skip. Answering it is the job of turning the numbers into a marketing plan, which is where a weekly analytics habit starts to pay for itself. Email results belong in the same review too; if email is part of your mix, our checklist for comparing email tools lists the reporting fields worth insisting on.
How do you evaluate business analytics platforms without an analyst?
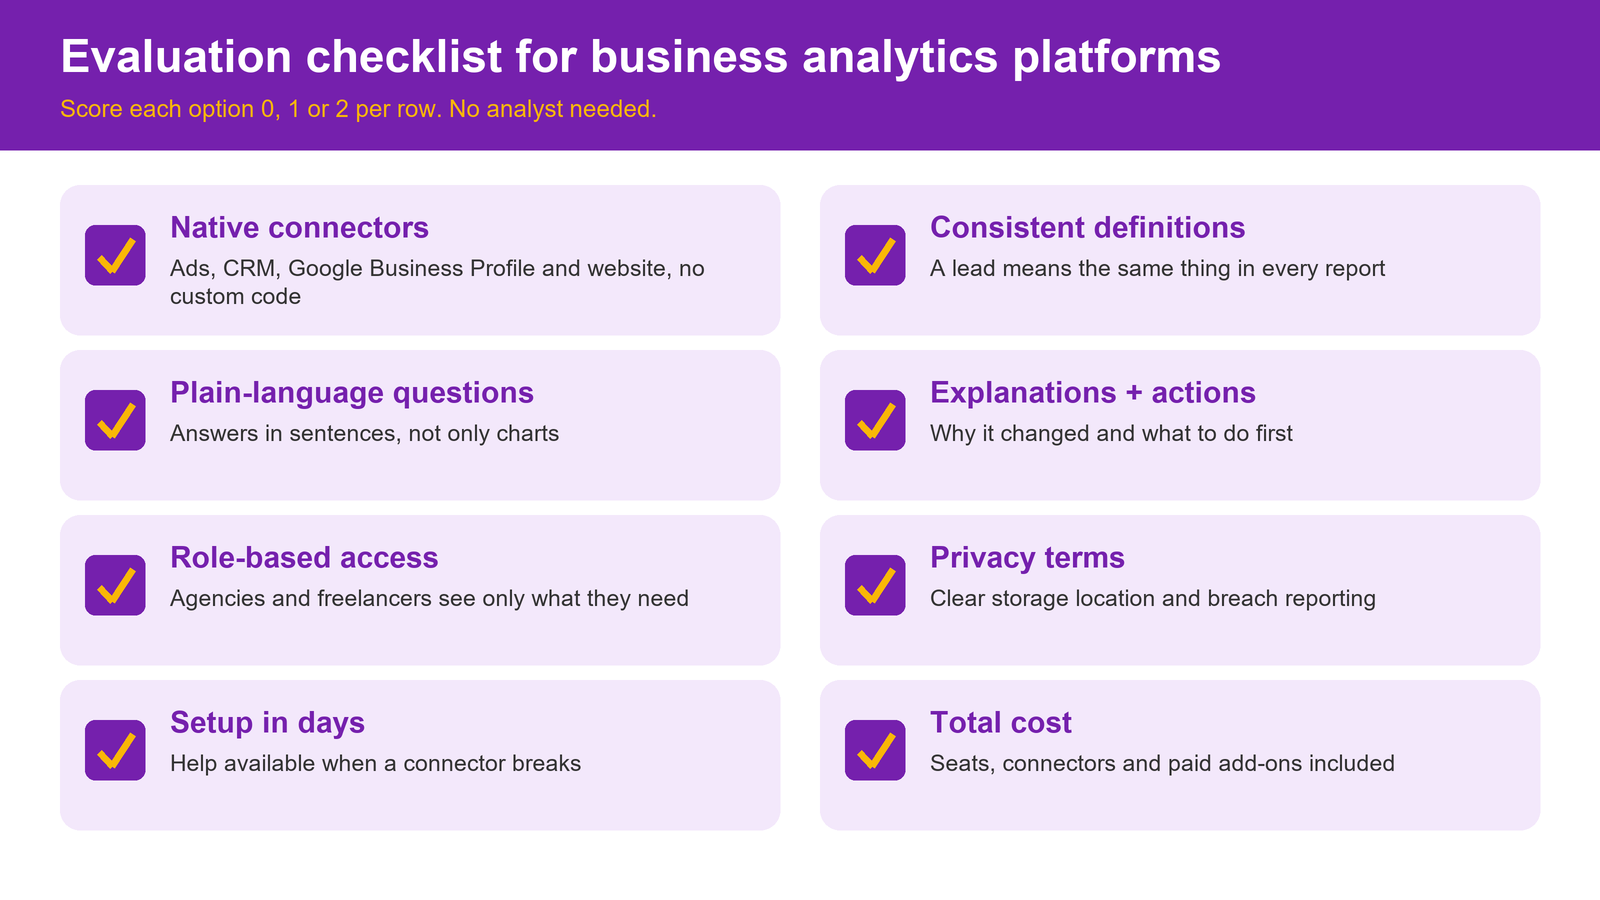
Most "best BI tool" lists are written for data teams who can write queries and model data. An SMB owner needs a shorter, more practical checklist. Score each option 0 to 2 on the following:
- Native connectors for the ad platforms, CRM, Google Business Profile and website analytics you already use, without custom code.
- Consistent definitions so a "lead" means the same thing in every report.
- Plain-language questions answered in sentences, not just charts.
- Explanations and recommendations, not only alerts.
- Role-based access so a freelancer or agency sees only what they need.
- Data residency and privacy terms that you can read and understand.
- Setup time measured in days, with help available if a connector breaks.
- Total cost including seats, connectors and any paid add-ons.
Cost deserves its own conversation because licence prices are only part of it. Our breakdown of what AI marketing platforms cost in India covers the hidden line items, such as onboarding, extra seats and the staff time needed to keep reports running.
Finally, check whether the tool keeps a human in the loop. The Leadmetrics site states that nothing goes live without human approval and that its experts monitor the analytics flow alongside the AI. Whatever platform you choose, look for a similar review step before any automated recommendation changes your spend.
What data privacy and access control basics apply in India and the UAE?
Connecting your CRM to an analytics tool means moving personal data: names, phone numbers, emails and enquiry details. In India, the government notified the Digital Personal Data Protection Rules, 2025 in November 2025. According to the Press Information Bureau release on the DPDP Rules, the Rules give an 18-month phased compliance timeline, require clear standalone consent notices, require businesses to inform affected individuals promptly after a personal data breach, and set a maximum of 90 days to respond to requests to access, correct or erase data.
In the UAE, the official government portal's page on UAE data protection laws explains that Federal Decree-Law No. 45 of 2021 on Personal Data Protection prohibits processing personal data without the owner's consent (with defined exceptions), places obligations on companies to secure personal data and sets rules for cross-border transfers. It came into force on 2 January 2022. Free zones such as DIFC and ADGM have their own regimes, so check which one applies to you.
In practice, three habits cover most of the risk for a small team:
- Give each person the lowest access level that lets them do their job, and remove access the day someone leaves.
- Keep only the fields you actually analyse. Lead source and stage are useful; full message histories in a reporting tool usually are not.
- Ask every vendor where data is stored, who can see it and how breaches are reported to you.
This is general guidance, not legal advice. If you handle health, financial or children's data, speak to a qualified adviser.
Conclusion
Business analytics for an SMB is not about owning more dashboards. It is about connecting the few sources that link spend to revenue, agreeing on what a lead is, and getting to the point where you can ask a plain question on Monday and get a straight answer. Move up the ladder one stage at a time, and do not expect AI answers to fix data that is still scattered across seven tools.
If you want to see how marketing, CRM and website data come together in one place, explore Leadmetrics analytics and business intelligence, or book a walkthrough with our team and bring last month's numbers with you.
Share on Social Media
Frequently Asked Questions
What is business analytics software?

What is the difference between business intelligence and business analytics?
Do small businesses need a data analyst to use analytics tools?
What is AI data analytics?
Which data should a small business connect first?
Are AI business intelligence tools safe for customer data?
How long does it take to move from spreadsheets to a connected platform?